## 什么是所谓的“Tidy Data”
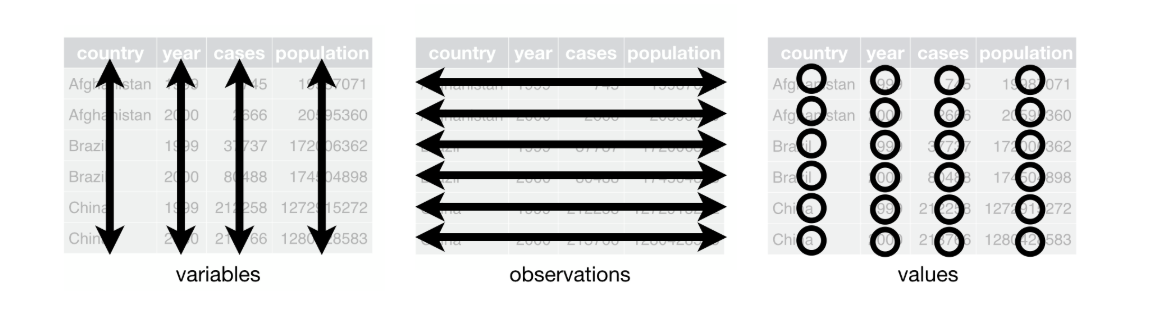
“Tidy” data is a standard way of mapping the meaning of a dataset to its structure. A dataset is messy or tidy depending on how rows, columns and tables are matched up with observations, variables and types.
我就不翻译了,Tidy data的三个特征。
每个变量(特征)是一列;
每个观测值是一行;
Each type of observational unit forms a table.
Tidy data到底有什么用?
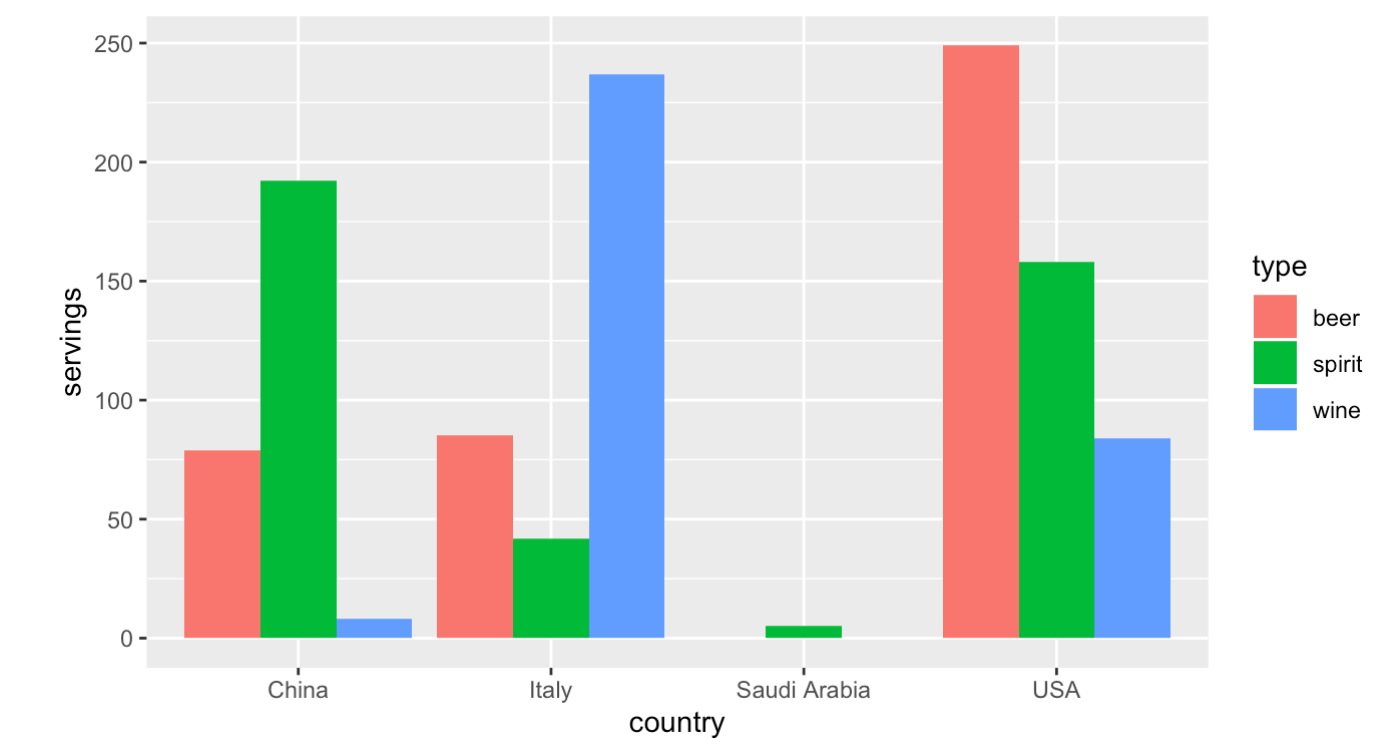
一个具体的例子,如果我有这样的数据,希望画下面的图,怎么实现?
pacman::p_load(tidyverse,nycflights13,fivethirtyeight,DT)
drinks_smaller <- drinks %>%
  filter(country %in% c("USA", "China", "Italy", "Saudi Arabia")) %>%
  select(-total_litres_of_pure_alcohol) %>%
  rename(beer = beer_servings, spirit = spirit_servings, wine = wine_servings)
drinks_smaller %>% datatable()
如果我们使用刚才的数据结构,能否画出下面的图呢??
显然使用drinks_smaller这个数据结构是没有办法画出这个图。
上面的数据结构不符Tidy Data的基本要求,Tidy Data的要求是每一行是一个观测值,显然这个数据一行包含了中国,啤酒、烈酒、红酒的消费数量。我们的想法是把数据转换为每一行是各个国家各类酒的消费量。
我们进行转换,将数据转换为tidy data
drinks_smaller_tidy <- drinks_smaller %>%
  pivot_longer(names_to = "type",
               values_to = "servings",
               cols = -country)
drinks_smaller_tidy %>% datatable()
Tidy Data才能进行画图
有了tidy data我们就可以画出我们需要的图
ggplot(drinks_smaller_tidy, aes(x = country, y = servings, fill = type)) +
  geom_col(position = "dodge")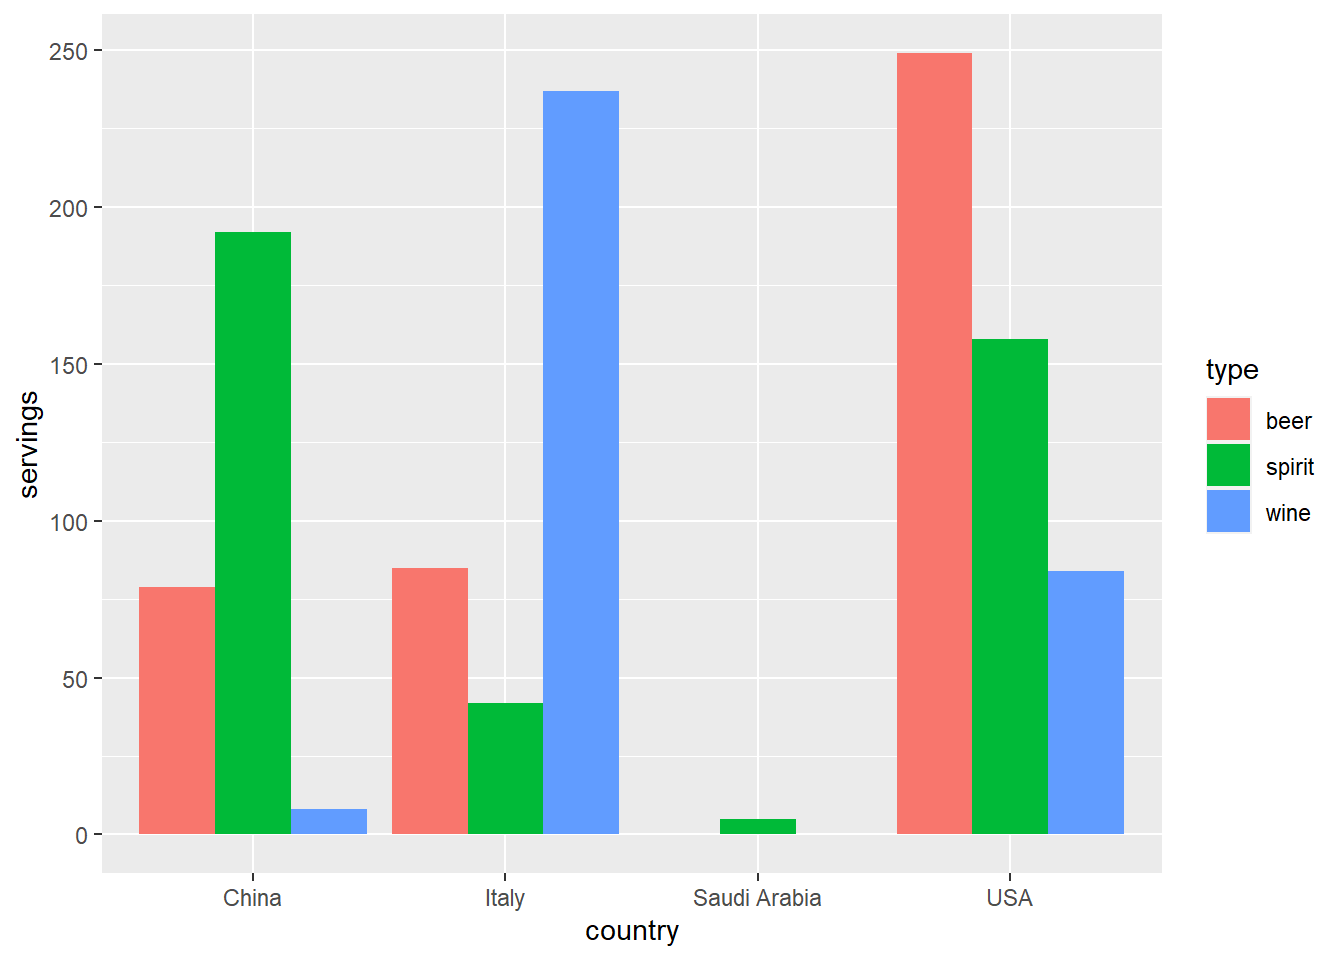
我们会经常使用长宽数据进行转换,pivot命令的帮助链接。
这个命令有几个重要的参数:
data:指明是那个数据库。
cols: 那些列要进行长宽转换看用选择也可以用“-”负号排除某些行,剩余行都是选进来的。
names_to:转换后新的类型变量的名字,这里面实际上把原来的列变量的名字转换为了观测值的指标。
values_to:转换后的值变量的名字,这下面是存储数值的。